Infographics
W e b | M o b i l e | T V | P r i n t
Infographics, short for “information graphics,” combine text, images and data to create a unified message that is stronger and clearer than each component alone. Infographics include a variety of designs, including symbols, pictograms, diagrams, timelines, maps, charts and graphs.
Highlight Important Facts
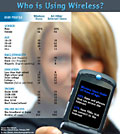
Television broadcasts, websites and newspapers use infographics to direct audiences to main topics and stories. Eyetrac III research—released by The Poynter Institute, the Estlow Center for Journalism & New Media and Eyetools—revealed that users scan web pages, stopping to read dominant and well-positioned headlines. Research also confirmed that larger images hold viewers’ attention longer than smaller images.
Organize Detailed Information
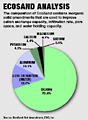
Illustration and strong visual organization allow readers to grasp key themes while viewing detailed facts and figures in an infographic. This is especially useful in conveying scientific data and financial statistics. Grouping related data makes it easier to remember the information.
Visualize Product Benefits
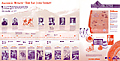
Companies use infographics to illustrate and compare product benefits. Interactive, animated and 3D infographics can be used to simulate user experience or product preferences. For example, a car manufacturer’s interactive website lets users choose car color and features. It dynamically assembles them, letting the user view and refine their “dream” car.
Understand Complex Concepts
Images may be simplified so that people focus on information essential to understanding the main concept. For instance, medical publications may use drawings to explain anatomical systems and medical procedures. Illustrations in infographics are simplified so that readers' attention is drawn to the main idea.
Infographics Increase Visual Appeal
With the enormous amount of news and information available, it is increasingly important to verify, organize, edit and display content so that the reader’s experience is enriched. Infographics can help acheive these goals.
|
|